
A post by Albert Ferrari
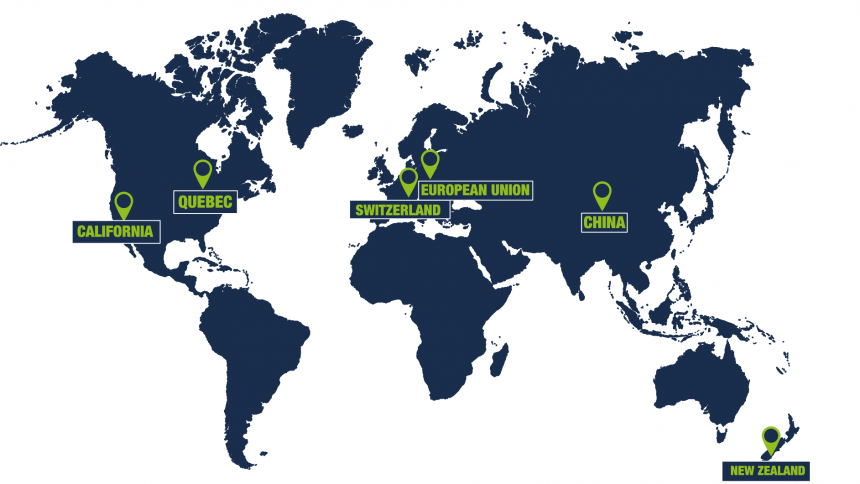
The introductory report “Informing the Carbon Market Policy Dialogue: the Emissions Trading Systems at a glance“ published in April 2020 is the first output of the project LIFE DICET – Deepening International Cooperation on Emissions Trading. It provides an overview of the five Emissions Trading Systems (ETSs) of the EU, California-Québec, China, New Zealand and Switzerland involved in the project.
The purpose of this initial report is to inform the Carbon Market Policy Dialogue (CMPD) between the European Commission, regulator of the EU ETS, and the regulatory authorities of the other ETSs about the current state of play of the ETSs. It lays the foundations for a subsequent comparative assessment, composed of different reports, that explore five major challenges of ETSs linking identified by the CMPD (see list here).
This introductory report describes the ETSs in their variety by collecting basic information about their main features (e.g., sectors covered, emission cap, allocation method, price etc.) as well as recent and upcoming regulatory developments affecting them. Table 1 below provides a summarised and simplified illustration of the carbon markets described in the report.
The below illustrated differences in the design features of the ETSs underline the importance of strengthening dialogue for further cooperation between ETS regulators. And this, in turn, is the precise intent of the CMPD: to create a space to better understand the contexts, mechanisms and objectives at stake as well as to foresee possible integration. Moreover, the two examples of ETS linkage included in the report (i.e., Québec-California and Switzerland-EU ETSs) demonstrate how different policies and prices can converge.
The first CMPD meetings, scheduled on the 10th and 24th September 2020, will discuss two topics of the comparative assessment: “Environmental ambition: scope, stringency, and policy mix” (Topic 1)” and “Price control: volume- and price-based mechanisms” (Topic 2). Two background reports on these Topics 1 and 2 are prepared by FSR Climate and its external collaborators to stir up the discussion during the meetings, and will be published after the event.
Table 1: Simplified summary of the ETSs included in the project LIFE DICET in December 2019
| California-Québec | China | European Union | New Zealand | Switzerland | |
| Establishment | Both California and Quebec ETSs were established in 2012. | Provincial pilots in place since 2013 | Operational since 2005 | Operational since 2008 | Operational since 2008, |
| State of linkage | California and Quebec Cap-and-Trade programmes are linked since 2013. | Linked with the Swiss ETS in 2020* | Linked with the EU ETS in 2020* | ||
| Covered gases | CO2, CH4, N2O, SF6, HFCs, PFCs, NF3, and other fluorinated gases | CO2 | CO2, N2O and PFCs | CO2, CH4, N2O, SF6, HFCs and PFCs* | CO2, NO2, CH4, HFCs, NF3, SF6, and PFCs |
| Coverage | 650 entities 85% of emissions | 3.000 entities in the pilots 30% of emissions* | 11.000 entities 45% of emissions | 2.400 entities 47% of emissions | 53 entities 85% of emissions |
| Sectorial scope | Electricity generation, large industries, combustion of fuel, including all commercial, residential, and small industrial sources, and fuel used for transportation | ETS pilots scopes vary amongst provinces but usually include power, heat and part of the industrial production above certain emissions thresholds. | Power production, oil refineries, steel works and production of iron, aluminum, metals, cement, lime, glass, ceramics, pulp, paper, cardboard, acids and, organic chemicals and civil aviation | Fossil fuel combustion, industrial processes, and other non-agricultural emissions. Opt-in possible for forestry post-1989. | Cement, chemicals and pharmaceuticals, refineries, paper, district heating, steel and other sectors. After 2020, civil aviation and power production will also be included. |
| Emissions cap | The emissions cap is set at 334 million allowances for California, and at 54 million for Québec in 2020*. It implies for California a decrease of 3% from 2015 to 2020, and an average of 4% each year from 2021 to 2031. For Québec, the decline is of about 3% each year. | The emissions covered are about 1,300 million tons in the pilots. A flexible cap is determined by performance standards reflecting the carbon emission reduction target and by the actual economic output. | The emissions cap is set at 1,816 million allowances in 2020*. It decreased by 1.74% each year from 2013 to 2020, and will decrease by an average of 2.2% each year from 2021 to 2030. | No national cap, initially implemented to rely on international Kyoto units. | 4.9 million allowances in 2020. It implies a decrease of 1.74% from 2013 to 2020, and an average of 2.2% each year from 2021 to 2030. |
| Allowance distribution (auctions, free allocation = FA, carbon leakage = CL) | California: FA facilities for transition assistance and to limit the risk of CL. Auctions are set for electricity and gas suppliers Québec: FA for emissions-intensive sectors at risk of CL. Fuel and electricity distributors must purchase 100% of their allowances. | Only FA is considered for the national ETS. In the pilots, most allowances are free, but a small part (less than 3%) are auctioned to facilitate a market price discovery. All allocations are free except in Guangdong province where there is a combination of free and paid allowances. | Power generators must purchase 100% of their allowances. Industrial entities deemed at risk of CL are given FA covering 100% of their benchmarked emissions. If not at risk of CL, FA is less generous: from 80% in 2013 to 30% in 2020. | Industrial allowances are free for processes deemed at risk of CL, based on benchmarks. One-off FA has been granted to owners of forests established before 1990 and holder of commercial fishing quotas. NZU can also allocated to post-1989 forest owners. | FA for industrial entities based on practically same benchmarks the EU ETS. |
| Offsets | Allowed up to 8% of an entity compliance obligation for Quebec and California. For California, between 2021 and 2025, 4% with less than 50% sourced from projects that do not provide any direct environmental benefit to the State. | Depending on the regional pilots, allowed between 2% and 10% and excluding projects in some sectors and certain gases. | Allowed up to 11% between 2013 and 2020. But no use of offsets is admitted after 2020. | Participants could use Kyoto’s offsets (ERUs, CERs and RMUs) for surrender, without any quantity limits until 2015. Then, they were not allowed to bank any Kyoto units. NZU could be exchanged and exported to offset offshore. | Kyoto’s offsets are accepted until 2021, then like the EU, not admitted from 2021 onwards. |
| Price control | Several measures are in place: Allowance banking, Multi-year compliance periods, Broad programme scope, Auction Reserve Price, Compliance offsets, Allowance allocation, Price containment reserve, Complementary direct regulations for emission reduction. | Price control mechanisms are different in most Chinese pilots’, however, they are generally soft or discretionary. | The Market Stability Reserve (MSR) allows to adjust the supply of allowances in the auction depending on the existing surplus. | Price ceiling since 2008 at fixed price of NZ$25. For all non-forestry sectors, one allowance was due for each 2 tons emitted, then the surrender obligation was increased to 2:3 in 2017, 5:6 in 2018 and has been established to 1:1 in 2019. | No price ceiling or price floor foreseen, and no mechanism similar to the MSR. However, hardship clause can be requested by companies if the cost of the emissions allowances severely damage its ability to compete. |
| Allowance prices | US $17 in November 2019 | Between ¥8 and ¥60 in December 2018 depending on the pilots | €25 in December 2019 | NZ $29 in December 2019 as there was an anticipation of the removal of the fixed price option | CHF 7.15 in March 2019 |
| Recent & future developments | Any modification of each ETS needs to be discussed between the two jurisdictions. The allowance price containment reserve will be replaced by price containment point and price ceiling in California from 2021 onwards. | A national ETS is to be implement, but the COVID-19 crisis has postponed its beginning. In the national ETS, the scope should cover 7.500 entities and 4,500 million tons of CO2. It would initially include the production & import of power and heat, with an opening to petrochemical, chemical materials & products, metals, paper, civil aviation at a later stage. At the early stage, it would not set neither an absolute cap or auctions. | A number of issues are currently discussed within the EU Green Deal strategy and post-Brexit-EU relations, including an increased ambition, inclusion of new sectors (building and transport), linking with UK and a carbon border tax. | A recent bill has passed in June 2020 and became law, introducing a supply cap, reassessment of industrial allocation and a price collar using allowances reserve if prices are too high or too low. Agriculture is preparing to and should be included in the ETS after 2025. | Linkage between the EU and Swiss has been ratified in December 2019: Switzerland will align with the EU ETS in terms of sectorial scope, allowances distribution and limitation in the use of offsets. |
Source: Report ETSs at a glance & *ICAP’s ETS map
Resources:
- Technical Report “Informing the Carbon Market Policy Dialogue: the Emissions Trading Systems at a glance“, FSR Climate, April 2020
- ICAP’s ETS map https://icapcarbonaction.com/en/ets-map
The views and opinions expressed in this post are solely those of the author(s) and do not reflect those of the editors of the blog of the project LIFE DICET.